Authors:
Kelly FitzpatrickPublished:
Today we’re sharing Cite Grid, a first visualization of our citation graph data. Citation graphs are a way to see relationships between cases, and to answer questions like “What’s the most cited jurisdiction?” and “What year was the most influential in U.S. case law?”
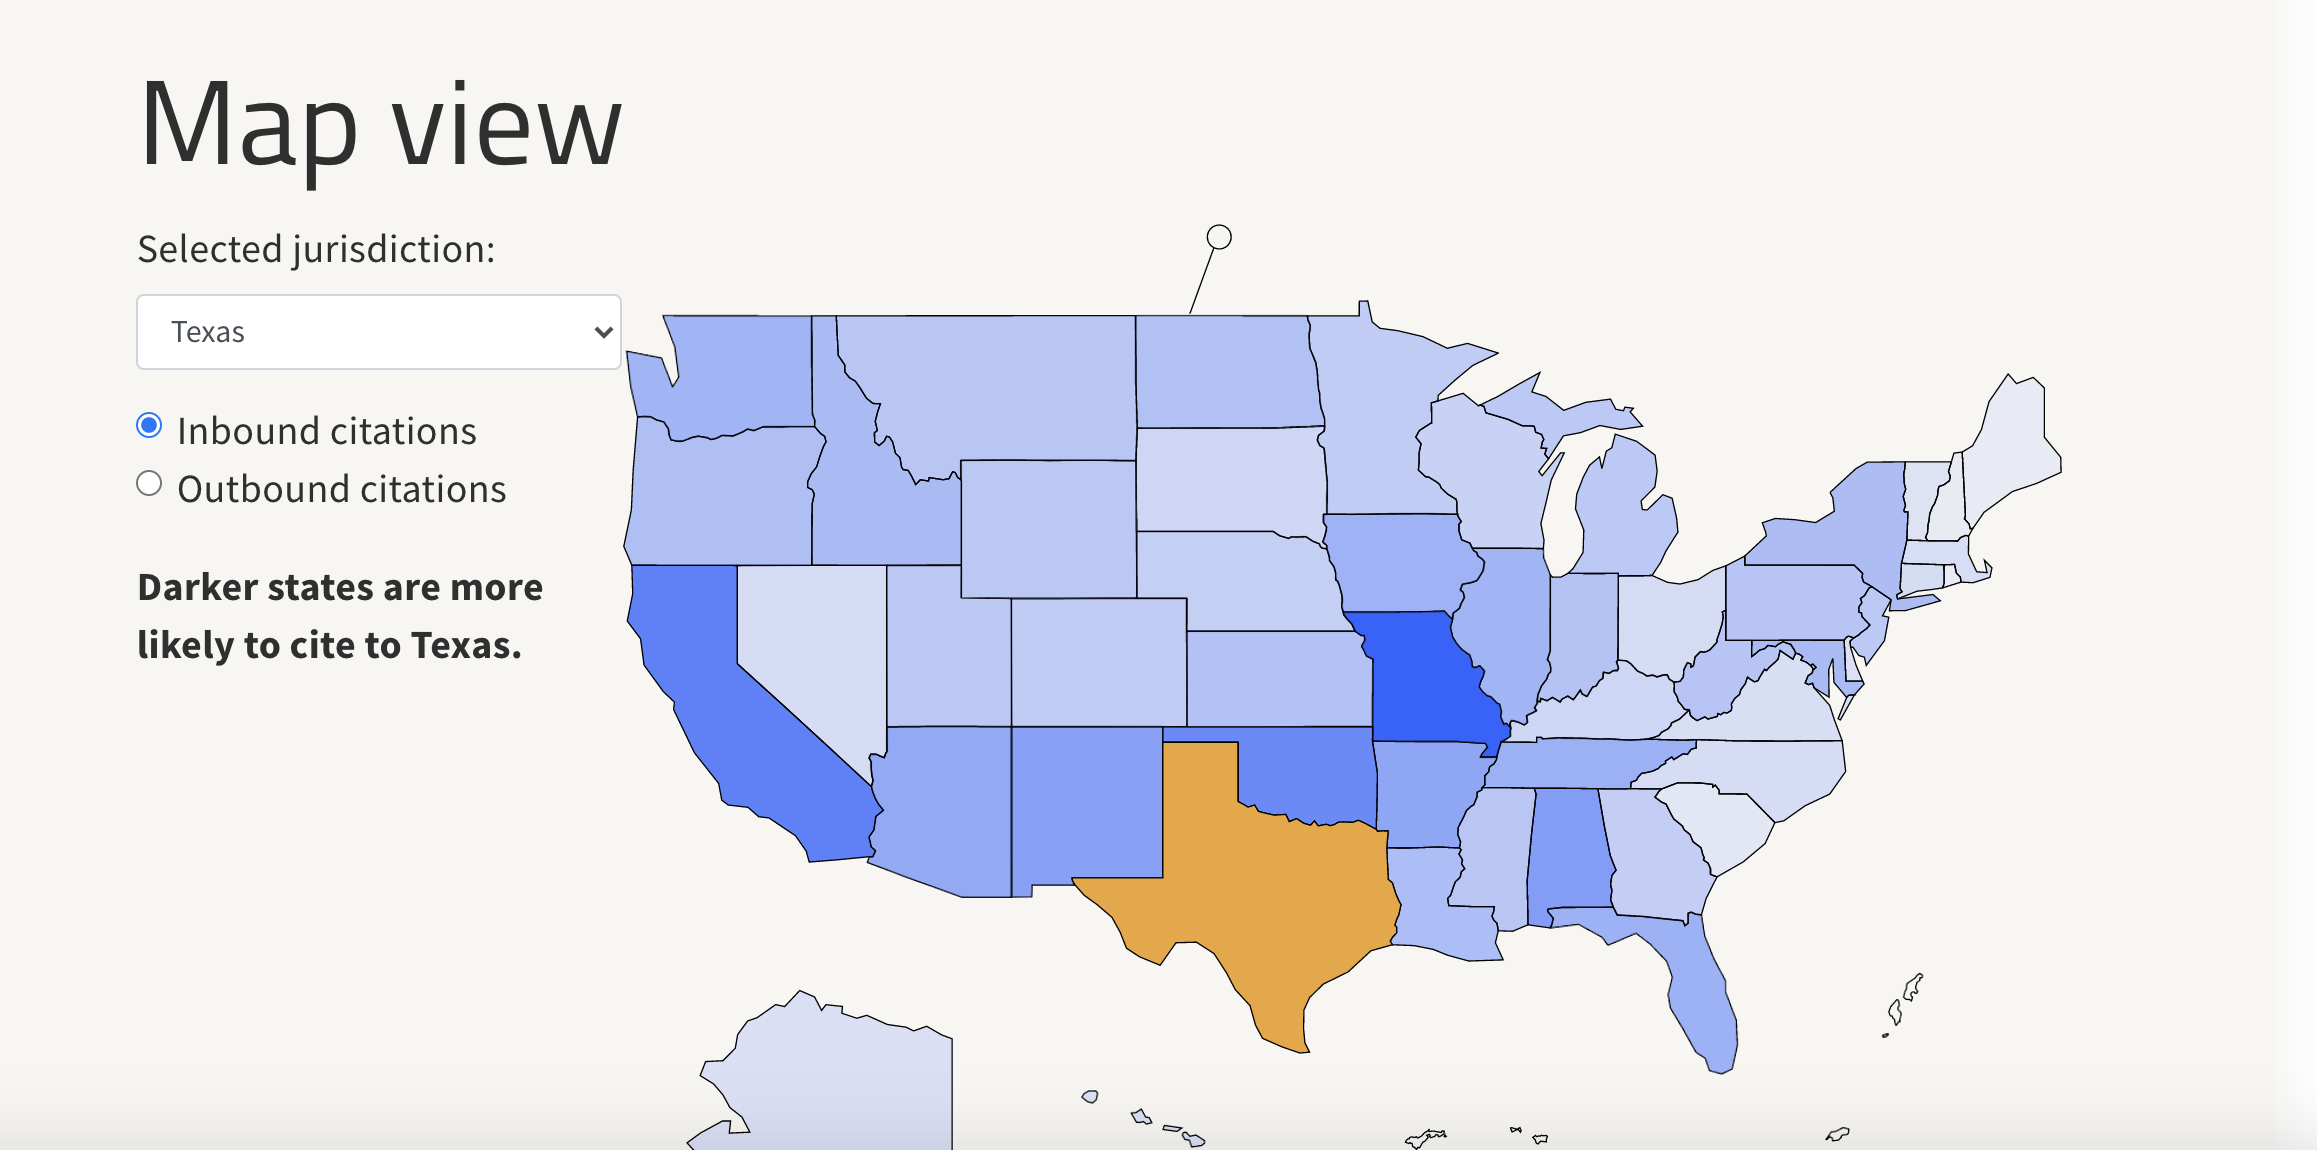
You can explore this visualization two ways. The map view allows you to select a jurisdiction, and view inbound and outbound citations. This shows states more likely to cite that jurisdiction in a darker color. For example, when viewing Texas, the states Missouri and California are shown as most likely to cite that state.
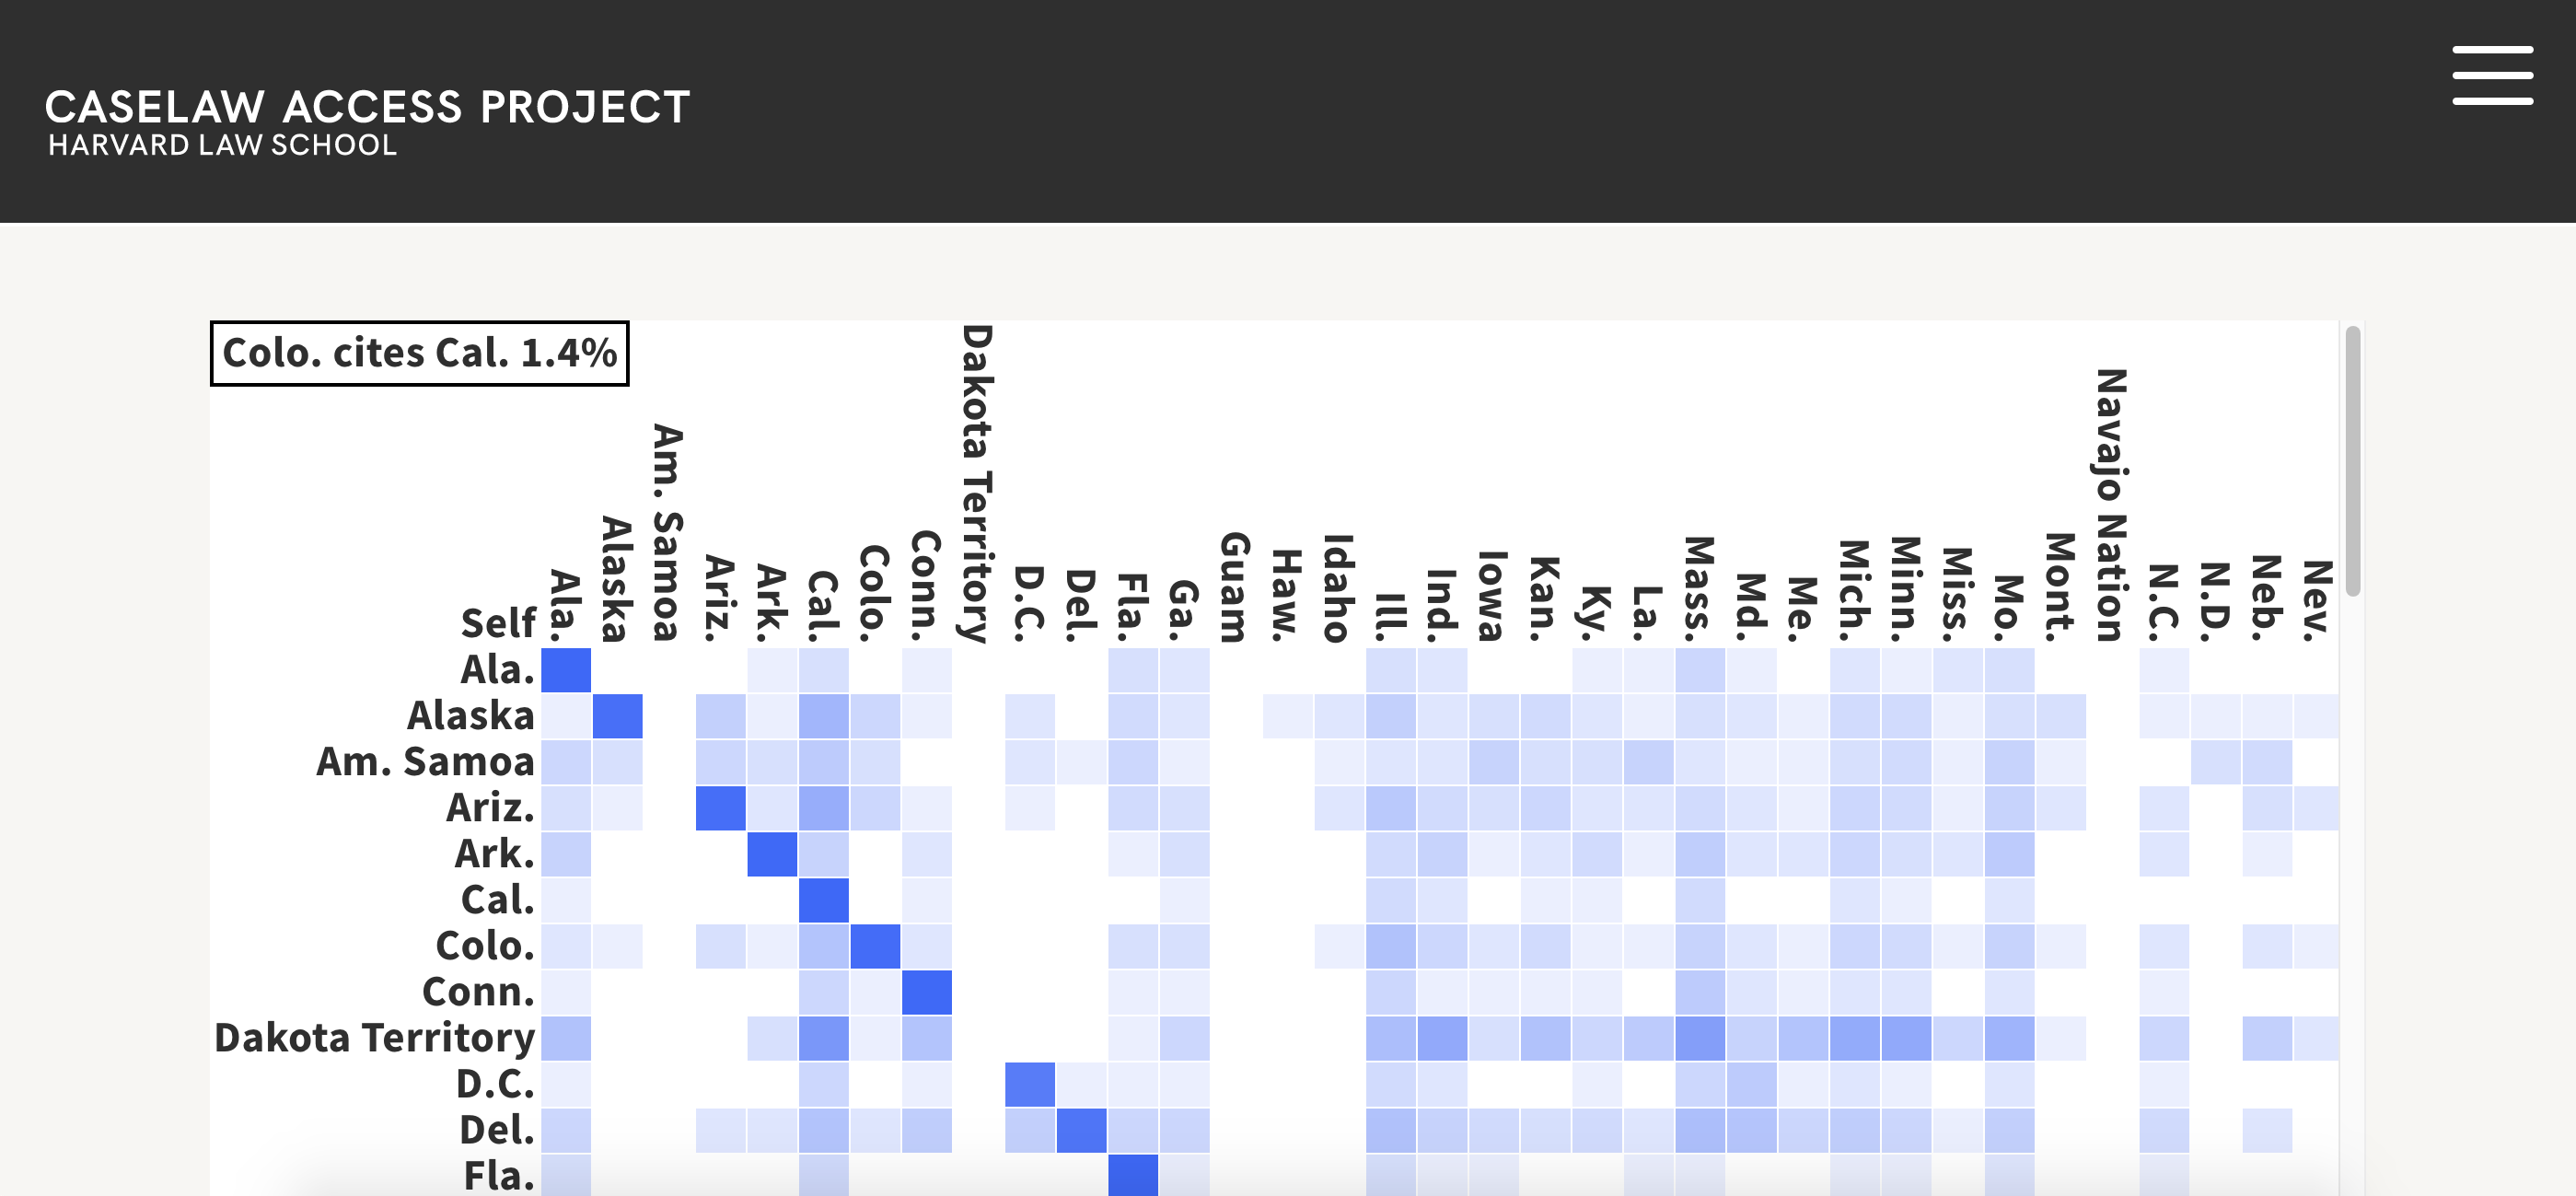
The grid view allows you to view the percentage of citations by and to each state. Here’s an example! When we select one square, we can see that 1.4% of cases from Colorado cite California.
Do you want to create your own visualization with the data supporting this tool? We’re sharing the dataset here. If you’re using our citation graph data, we want to hear about it, and help you spread the word!