Authors:
Rebecca KilbergPublished:
At LIL, we’ve been providing users with the ability to preserve online sources via Perma.cc since 2013. Running a digital archive puts us in the “forever business”–what’s online today may be gone tomorrow, but that Perma Link you saved should never expire. Promising to host something forever brings with it different challenges than hosting something for a month or a year. There are the technical burdens: How will we guarantee these links stay accessible even as the underlying technologies continue to develop? There are logistical concerns: Where will we put all these files? There’s also a question of cost: Just how much does it cost to store a file forever?
The last question in particular has interested me since my arrival at LIL as a technologist in residence. Part of what attracted me to the lab was that it was engaged in reckoning with the value and cost of doing something forever. In this post, I attempt to answer how much it costs to store files long term economically and ecologically, and find, as expected, that the question isn’t as straightforward as it looks.
The Economic
Running a forever service means we have to account for paying for that thing for the long term. To begin to answer it, we first had to gather some data. We figured out how many gigabytes we are using in our production database and how many individual objects we store, and used those two numbers to calculate the size of an average link. We then looked at how much money we were spending per month on the services we use to store Perma Links. We determined we spend about 1/100 to 2/100 of a penny to store an average object each month, or .12 to .24 of a penny per year.
How do you use those numbers to calculate the cost of storing something forever? One way to get at that answer is by performing a capitalized cost analysis. A capitalized cost analysis determines the current value of something that will exist on a long timescale. The formula for capitalized cost is up-front cost + maintenance cost * (1/interest rate). In our case, we don’t have an interest rate, but we can make a fairly similar calculation, taking the nominal annual payment (p), the rate of inflation ®, and time (t). For each year, we’ll take p * (1 - r)^t, then we add them up to infinity. In this chart, infinity is represented by 100 years, and we’ve graphed the cost of 1 link, 10 links, and 100 links over time.
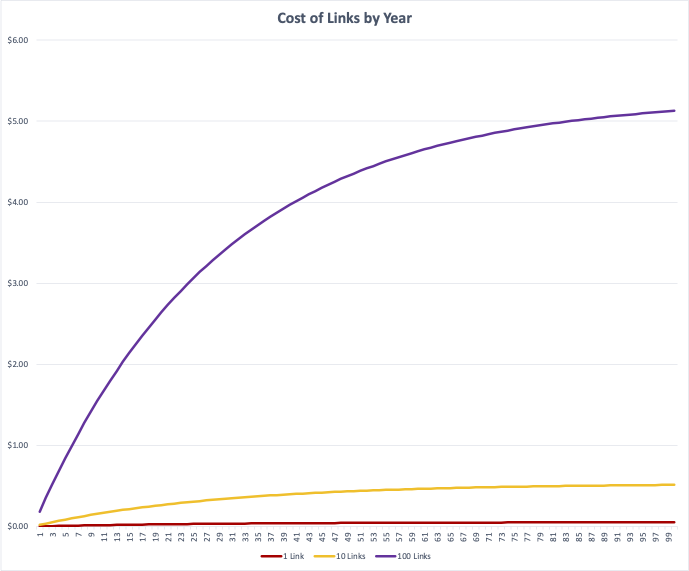
You can see that after a certain amount of time, the curves all begin to flatten out. With our current storage cost model, over 100 years a single link costs about $0.05 to maintain, meaning 10 links cost $0.51, and 100 links cost about $5.13.
At first glance, this seems very affordable! But though this is where our calculation ends, this is not where the expenses do. To begin, we did not include the up-front cost of creating the link. Calculating up-front costs for a link would include the costs of creating the entire Perma.cc infrastructure from scratch. It would also have to account for the cost of the current Perma.cc site’s underlying capability–how we create the links themselves. This is especially hard to account for at this moment, since we have recently started to use Scoop to capture links. Now we’re using client-side playback, which changes the calculation for our object retrieval costs, even if the cost of storage stays the same. There’s also the issue of what we capture: the average web page size has more than doubled since Perma.cc started in 2013. Additionally, as an archival service, we keep at least one other copy of all Perma Links ourselves, and we also send a copy of most links to the Internet Archive. None of these costs are accounted for in the calculated figure.
That’s not all. The most significant unaccounted cost is our labor: Perma.cc needs people to run it. Our developers add new features, fix bugs, and continually improve our code to make sure we’re serving our users. There’s also labor that goes beyond the code: conducting user research, supporting users already on the platform, and helping new users to join are just a few of the other types of work that go into running the service. All of these efforts pile on costs, which means that nickel doesn’t represent a full economic portrait of Perma.cc’s cost–it’s just a small piece of the larger picture.
Finally, though this calculation tells some of our story, we can’t really speculate about other digital archives’ costs. Not only are more groups running their own archives than ever, there is increasing diversity in the technology underlying various web archiving efforts. As a result, what we’re doing is likely not a reflection of how other groups manage digital preservation, and our costs do not necessarily mirror those of our colleagues in the field.
The Ecological
We also have to consider that cost can be other than monetary. When we began thinking about the costs of web archiving, one area that stood out was the ecological cost. Challenging as it was to come up with an economic portrait of our work, it was an even bigger task to account for the impact that our work might have on the planet. We’re not the only lab to have interest in this question, but like most, have found limited success answering it. We were especially interested because we’ve been considering running Perma.cc on-premises, rather than through cloud service providers like we do now.
There has been a push in recent years for large cloud service providers to allow users to explore their services’ carbon emissions. As a result, a number of cloud providers have either built out dashboards or released public information about users’ carbon emissions. Admittedly, carbon emissions are not the only way to measure climate impact, but cloud providers do not provide information relevant to other measures such as water use, despite water use being an outsized concern for data centers.
We use Amazon Web Services (AWS) and Hetzner, which do not provide in-depth information about the likely carbon emissions of a project’s infrastructure. As a result, we cannot provide a true accounting of Perma’s carbon footprint. However, we can shed a little more light into what it’s composed of, and how that would differ were we to bring our operations on-prem.
We can turn to life cycle assessments (LCAs)–a tool to evaluate the emissions of a product over its entire lifespan–to understand more about the emissions produced by a given product. LCAs and life cycle inventories include various phases in a product’s life cycle: manufacturing, distribution, use, and end of life (the eventual destruction or recycling of a product). Some companies release LCAs of their own products.
One such example is the LCA for Dell’s PowerEdge R740 server, which is comparable to others that have been used in studies to represent the kinds of servers that might be used in data centers. We’re not using those servers specifically, but it’s helpful to understand the kinds of emissions that might be created in a server’s lifespan. In this case, these servers produce 10,794 kg carbon dioxide equivalent (CO2 eq) Global Warming Potential (GWP) over 100 years. According to the LCA, most of this CO2 eq (6,667 kg) is emitted during the use phase, the majority of which comes from electricity use. Manufacturing of the server emits 4,320 kg CO2 eq, 6 kg CO2 eq is emitted during transport, and -199 kg CO2 eq in the end of life phase (likely a result of recycling). Though we cannot use this information as a reflection of what our own emissions are likely to be, it does give us some grounding in our attempts to understand the ecological costs of our infrastructure.
To understand more about the use phase, we can dive a little deeper into how the cloud providers that host and store our services are powered. Our Hetzner services run in the Germany and Virginia regions. Hetzner claims to use renewable resources to power its data centers, though it only explicitly mentions its German and Finnish regions in its public materials. Amazon also claims to use only renewable resources in its northern Virginia region, where we run our services. This claim has previously been called into question, and is further complicated by how the renewable energy is sourced. Claims about renewable energy in Amazon’s other regions–such as its Oregon region–have also been questioned. So while we expect the electricity for our services to mostly come from renewable sources, we maintain some skepticism.
Regarding whether it would be more ecologically sound to host our services on-premises, it seems likely it would be less environmentally friendly to do so. This answer too depends on certain unknown factors. As illustrated by the LCA for the Dell servers, most of the carbon footprint for servers arises from the use phase. If we could guarantee that our electricity was coming from renewable sources rather than the typical energy composition in Cambridge, that would significantly offset those emissions. For manufacturing, if we could right-size our machines and select servers that were optimized for lower carbon emissions, we could also potentially reduce the manufacturing footprint. Reduce, but never eradicate–these machines remain resource-intensive to build.
Even if we were able to manage these optimizations, there remain certain efficiencies of using a large cloud data center that are not available to a small operation with an on-premises server room. Mostly these have to do with temperature: since servers emit heat but need to be kept at a certain temperature, they typically require some form of cooling (which has its own associated carbon footprint). Finally, there would be increased maintenance costs, since we’d be maintaining the infrastructure ourselves rather than as part of a data center. These include the costs of equipment upgrades, which likely happen more regularly in a cloud provider data center, depending on the zeal of the on-prem administrators. While this might mean newer, more efficient hardware is being used, it also likely would create more waste, as the hardware is cycled more frequently.
So, what does this mean?
Now that we know a little more about some of the costs of digital preservation, how do we reckon with them? The argument here is not that we should halt digital preservation. After all, whether we’re preserving a link in a data center or a book in a library, preservation has always had some cost. The digital archive is just the latest instantiation of a far older practice. However, we should also not act like preserving something digitally is without cost.
Part of this perception stems from the lack of physical instantiation of digital products. It’s easy to decide everything is worth preserving when there are no apparent consequences to preservation. While analog archivists must constantly reevaluate collections based on their limited resources, up to this point we at LIL have not had to make similar determinations. Part of that may be that our archive is relatively new, but part of it may also be that our facilities appear, for the moment, limitless.
We might also consider a relatively unique quality of our archive that makes it hard for LIL to be opinionated about what to preserve: we do not determine what goes into Perma.cc. The archive is defined by the community of users, most of whom are not affiliated with one another. Our users are our curators; they evaluate what is worth preserving. Though some have similar aims (like preserving references for legal cases), there’s enough diversity that the links taken together are not homogeneous.
We will eventually begin to contemplate the limits of our services. We will need to decide, along with Perma users, how to manage our finite resources. How can we keep our promise of forever while recognizing the constraints of time and space? Understanding the costs of our archive can help us identify a sustainable answer to that question.